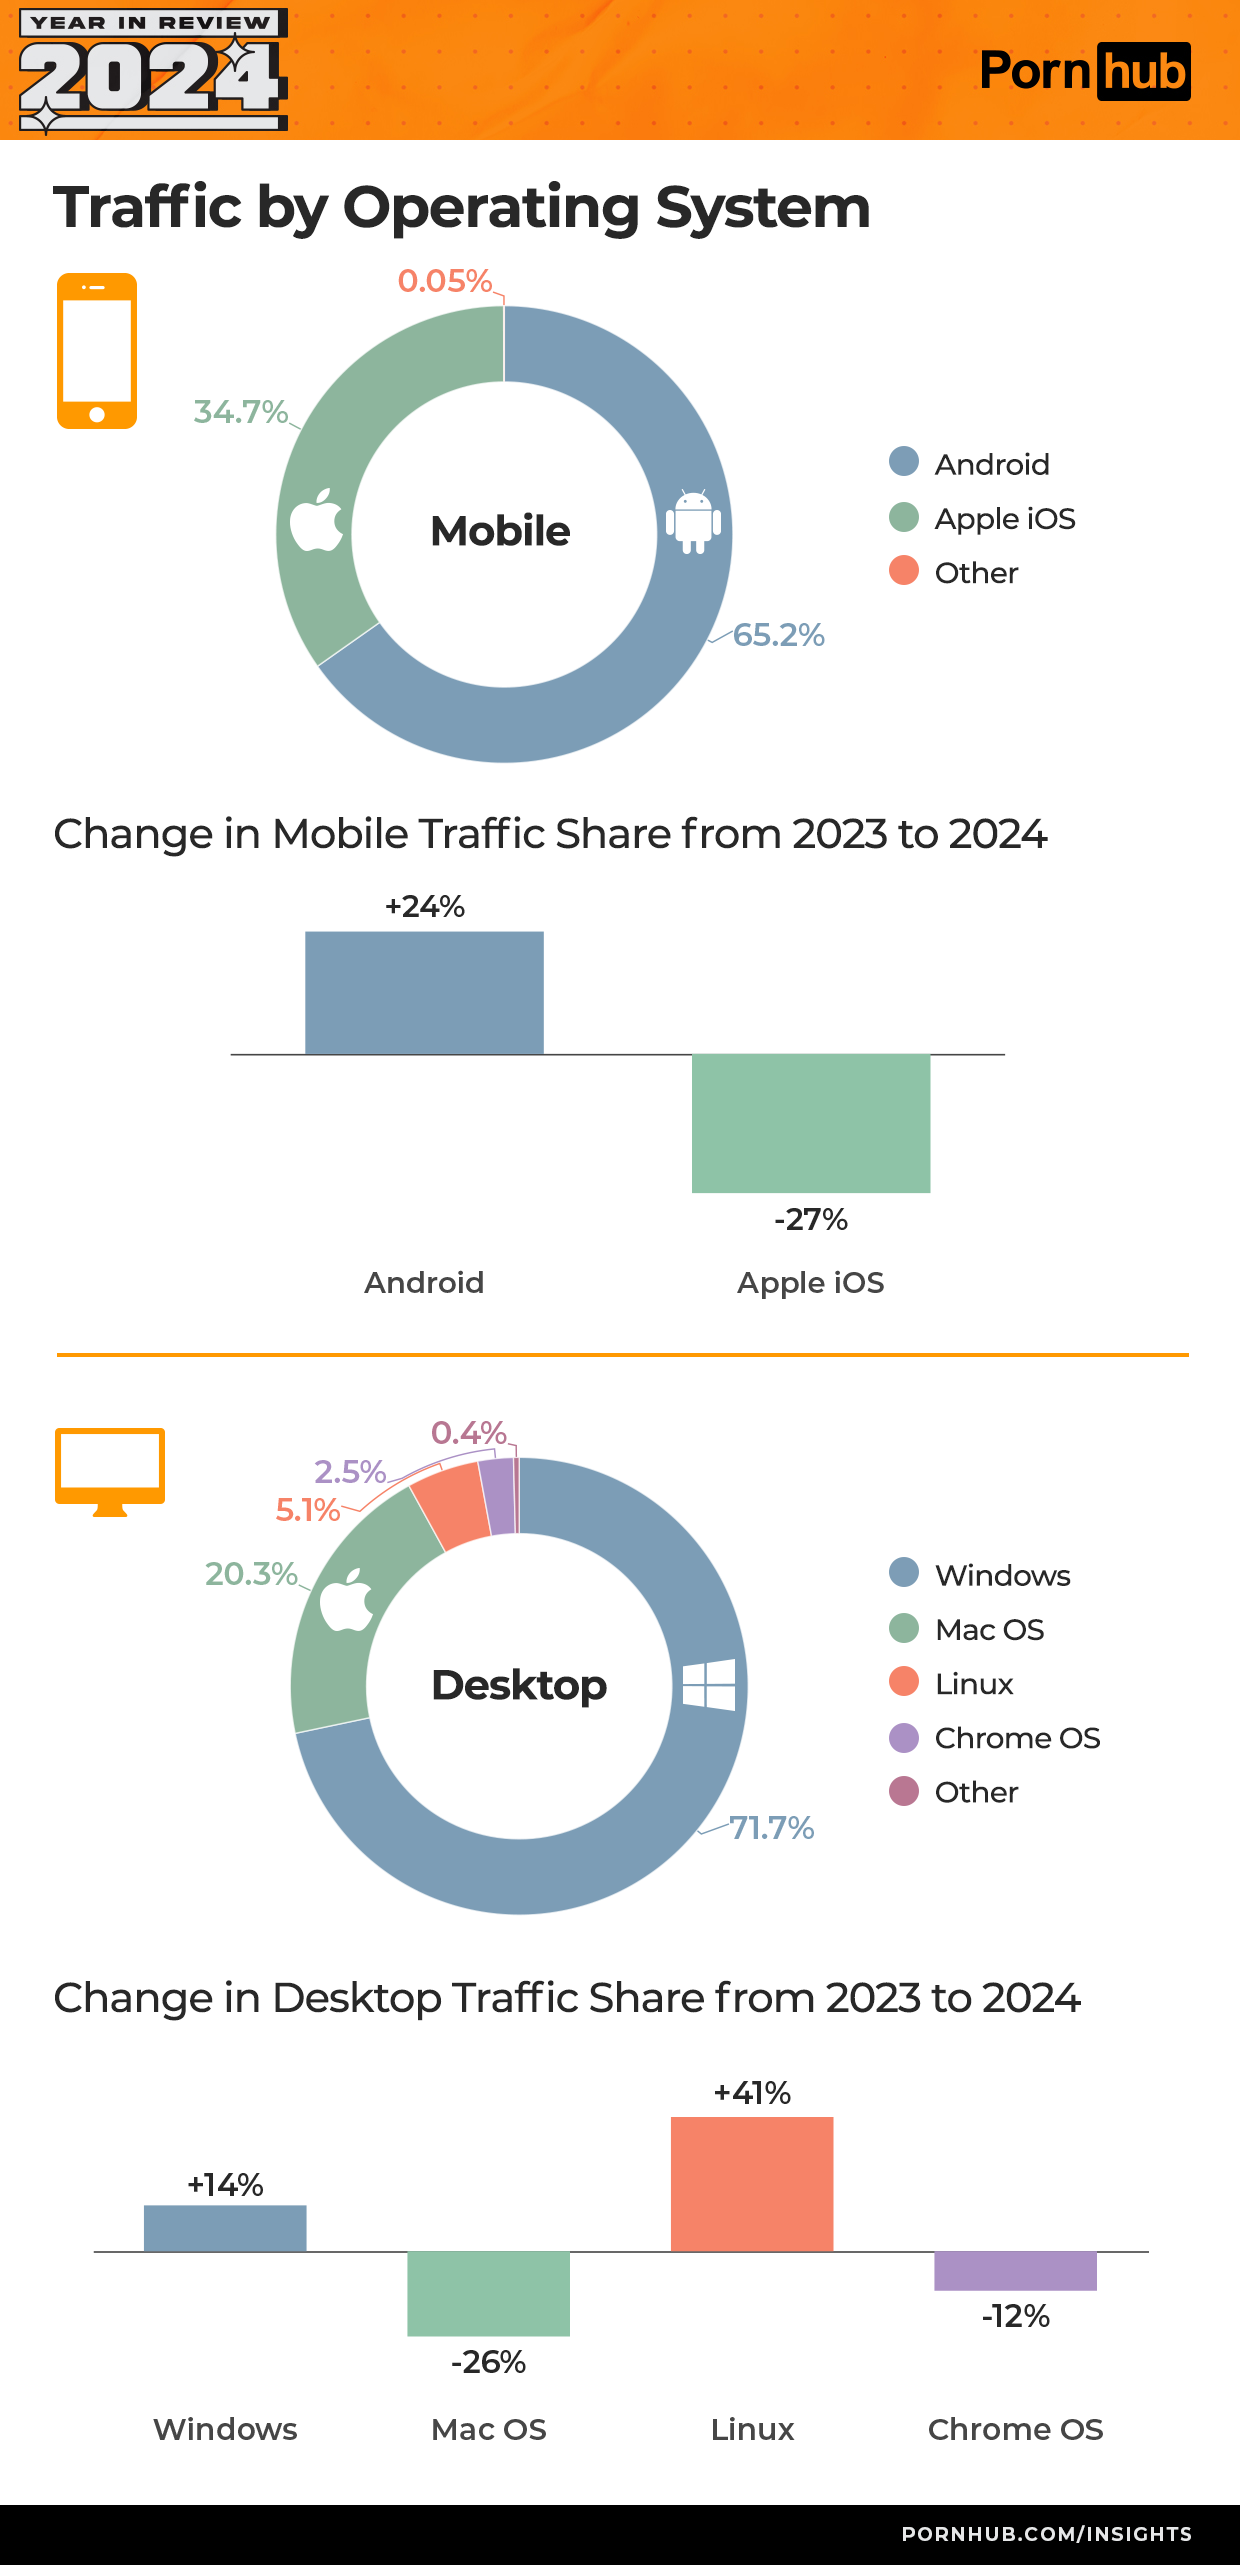
I'm really curious as to what OSs comprise those "Other", both for desktop and mobile
I don't like how the bar graphs, obviously supposed to show percentage points, actually show relative percent change.
What graph works better to show relative percentage change?
Bar graph of absolute percentages before & after overlaid. For example, a darker outline rectangle for 2023 and a lighter filled rectangle for 2024. Or just two rectangles next to each other, as lots of business charts do.
load more comments
(3 replies)
load more comments
(1 replies)
Haha hello anon
this post was submitted on 11 Dec 2024
459 points (97.9% liked)
Data is Beautiful
852 readers
4 users here now
Be respectful
founded 6 months ago
MODERATORS