607
you are viewing a single comment's thread
view the rest of the comments
view the rest of the comments
this post was submitted on 11 Nov 2024
607 points (92.0% liked)
Data is Beautiful
4528 readers
38 users here now
A place to share and discuss visual representations of data: Graphs, charts, maps, etc.
DataIsBeautiful is for visualizations that effectively convey information. Aesthetics are an important part of information visualization, but pretty pictures are not the sole aim of this subreddit.
A place to share and discuss visual representations of data: Graphs, charts, maps, etc.
  A post must be (or contain) a qualifying data visualization.

  Directly link to the original source article of the visualization
    Original source article doesn't mean the original source image. Link to the full page of the source article as a link-type submission.
    If you made the visualization yourself, tag it as [OC]

  [OC] posts must state the data source(s) and tool(s) used in the first top-level comment on their submission.

  DO NOT claim "[OC]" for diagrams that are not yours.

  All diagrams must have at least one computer generated element.

  No reposts of popular posts within 1 month.

  Post titles must describe the data plainly without using sensationalized headlines. Clickbait posts will be removed.

  Posts involving American Politics, or contentious topics in American media, are permissible only on Thursdays (ET).

  Posts involving Personal Data are permissible only on Mondays (ET).
Please read through our FAQ if you are new to posting on DataIsBeautiful. Commenting Rules
Don't be intentionally rude, ever.

Comments should be constructive and related to the visual presented. Special attention is given to root-level comments.

Short comments and low effort replies are automatically removed.

Hate Speech and dogwhistling are not tolerated and will result in an immediate ban.

Personal attacks and rabble-rousing will be removed.

Moderators reserve discretion when issuing bans for inappropriate comments. Bans are also subject to you forfeiting all of your comments in this community.
Originally r/DataisBeautiful
founded 1 year ago
MODERATORS

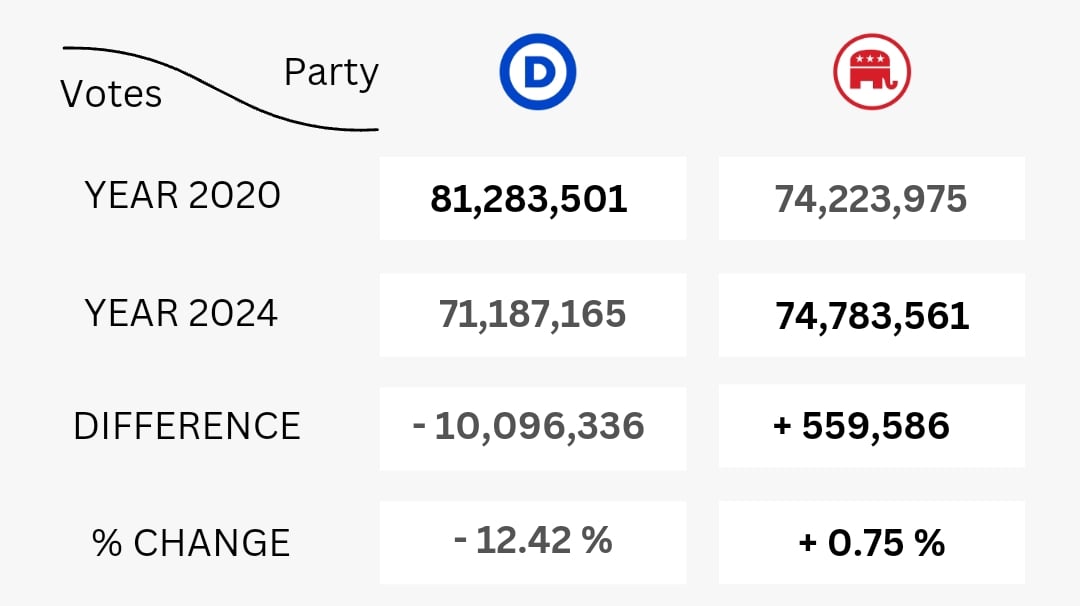
Cool! Key takeaway for me from this is Trump didn't get more popular, Dems just got way less popular. Kind of brings a bit of my hope in humanity back a little
Still kinda sucks that the Dems lost popularity. I wonder if it would have been different if Biden was on ticket.
It isn't hard for me to believe that 1 in 8 people would refuse to vote for someone because their gender or color.
On a side note, I'm getting older and losing touch with new music, but are women's punk rock bands not as popular as I once remember them being or what? The world could use a little more fuck the patriarchy.
Im not sure, but I feel like girl led punk rock is making a resurgence lately, though the definition of what punk rock is may be arguable
Grlwood is an artist that comes to mind, but there are others for sure
Checkout ‘fuck me up’ from them
Ugh that’s depressing but I think you’re right.
It doesn't help anything but if you consider that our population grew by 6 million during that time and 22% (kids) can't vote. Then say that only 46% of the population votes... Trump should have had right over 2 million more votes this election, aka he lost votes when accounting for population growth.
Somehow Kamala is the patriarchy though?!:-P
Not as much as The Donald, ofc, but Kamala came across as being basically the same as Joe Biden, or at least it looks like that was what she was aiming for.
Anyone you mind sharing? Id like to see what's out there, plus I figure if you get 1 name to start with that's decent, some streaming apps might find songs similar.
When I listen to punk these days it's always older music, but I figure that is just the algorithms thinking it's what I want because I started it with an older band/song.
I also should move on from Pandora at some point. I had the cracked version of Spotify for a bit, but never bothered reinstalling after I cracked my phone screen setting it down on a hotel bedside table. It couldn't have fallen more than 2-3 inches. I wanted to blame it on the top being fake marble or something, but in the end the fault was mine.
Here are some of my favorites
Sorry, deleted my comment because I realized the bands I was thinking of weren't really punk necessarily, though they are counterculture. I really like Speedy Ortiz--they've toured with some big names like Liz Phair, and recently did a Tiny Desk concert. A few months ago i saw them live and a band called Suzie True opened, which is a little introspective about problems still but I think has a ton of potential to write some banger callout /protest songs and I've really enjoy listening to them.
Thanks for the response, I'll check them out sometime