this post was submitted on 30 Aug 2025
467 points (95.7% liked)
Data is Beautiful
2704 readers
42 users here now
Be respectful
founded 1 year ago
MODERATORS
you are viewing a single comment's thread
view the rest of the comments
view the rest of the comments
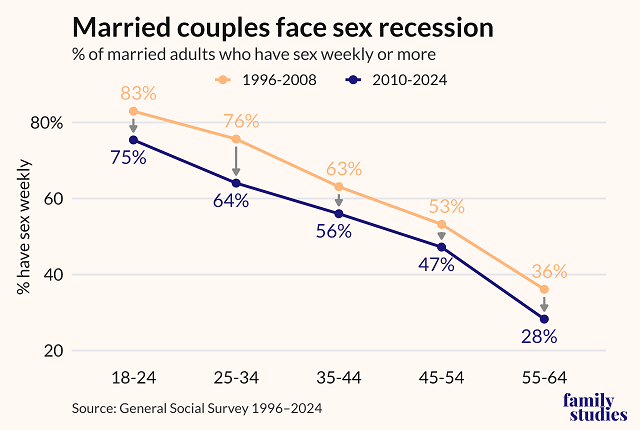
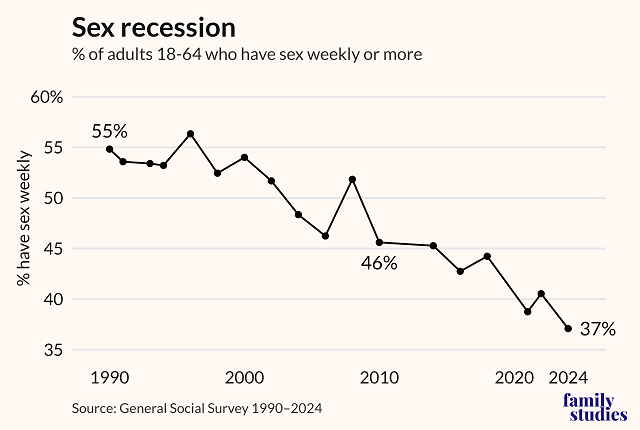
It took me a moment to parse it, too. It's trying to show the decrease in each age group between the earlier range of years and the more recent one. I'm guessing they're lumping all those years together into a single value to minimize the effects of any short-term trends.