[SOLVED] Hurray! I did it!

Solution: You need to have Generic monitor xfce link installed [available almost on every DE out there]
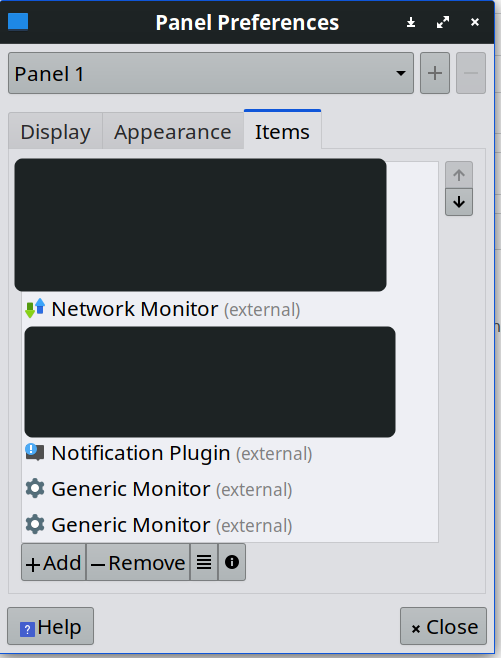
Two finger Tap on Panel Panel (dropdown) > Panel Preferences > Items > Add Item > Generic Monitor

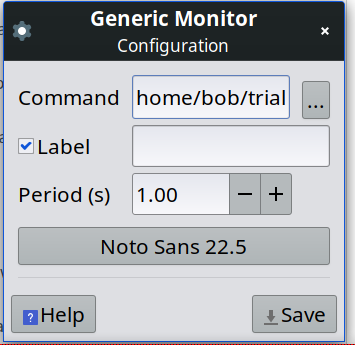
In generic monitor give the exact location of the script like I have done here (also copy other details too)

Now save
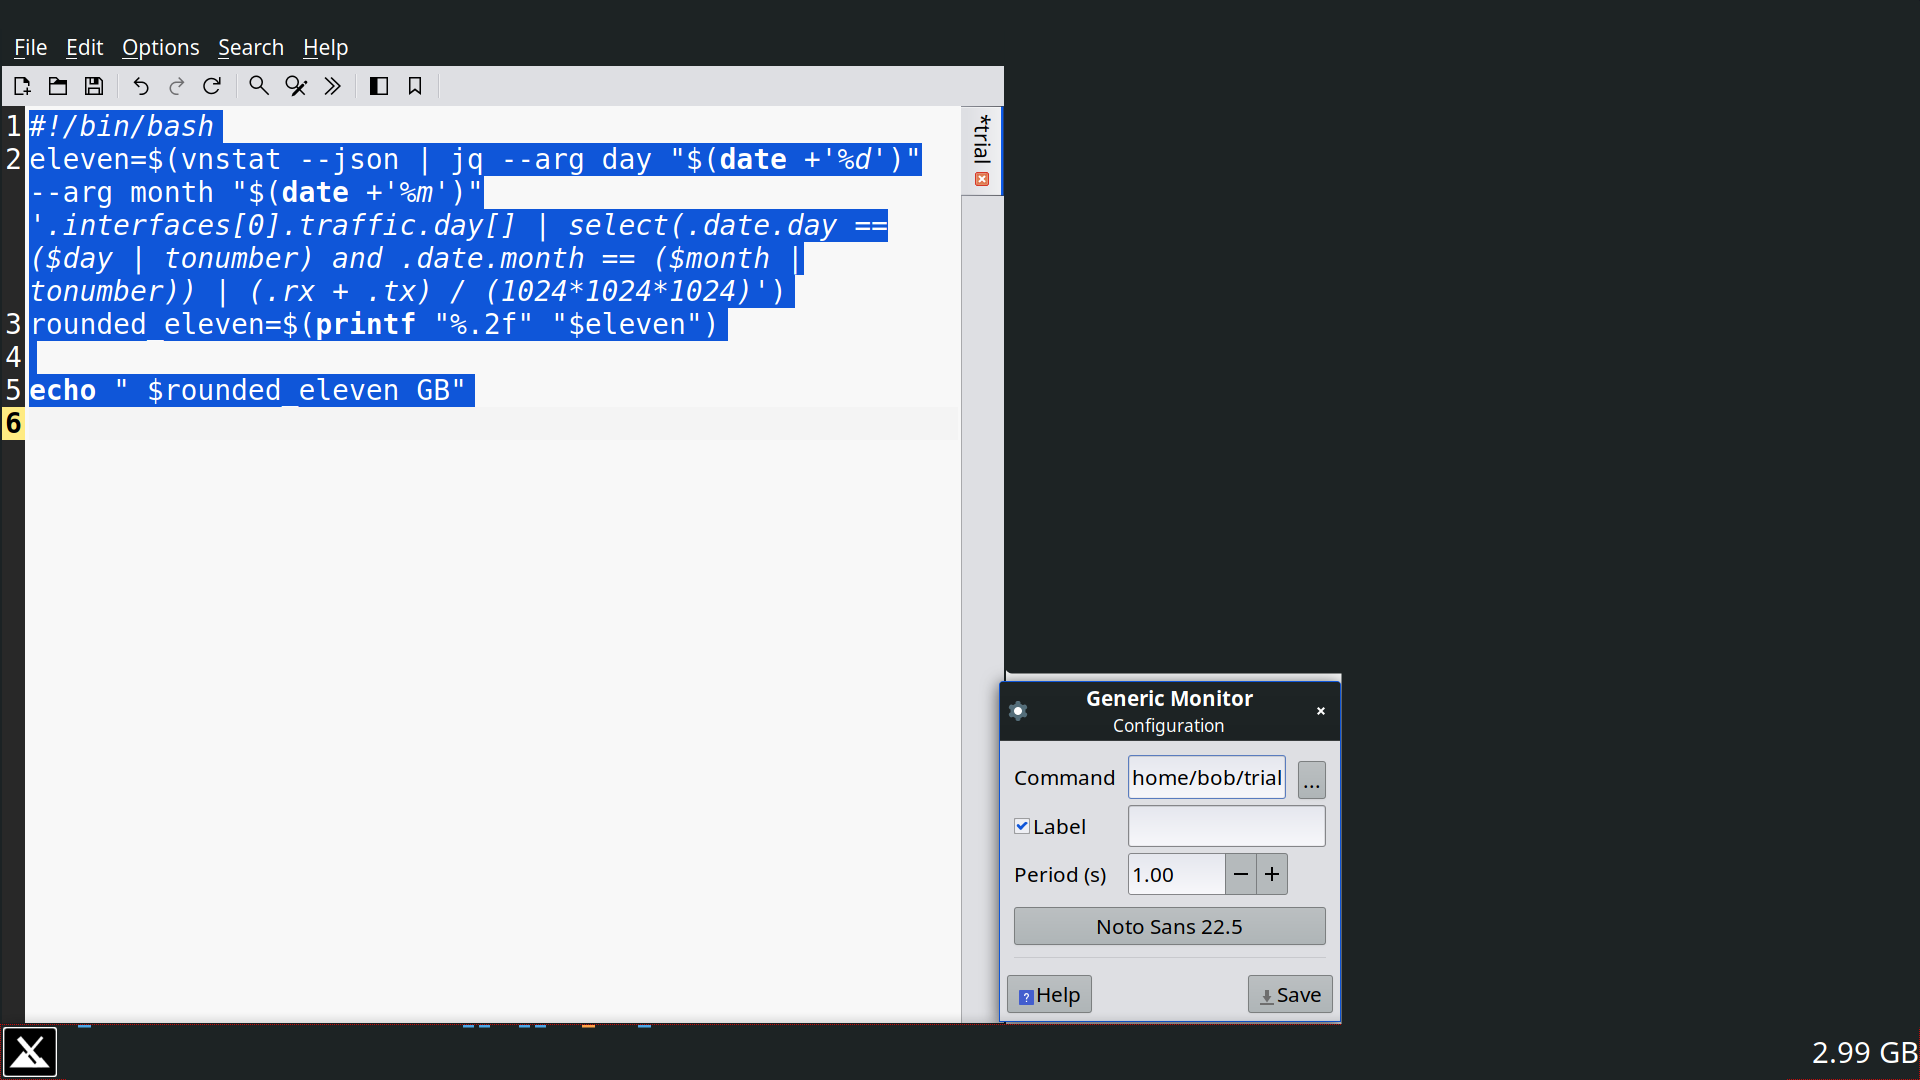
Here's what is in the trial file
#!/bin/bash
eleven=$(vnstat --json | jq --arg day "$(date +'%d')" --arg month "$(date +'%m')" '.interfaces[0].traffic.day[] | select(.date.day == ($day | tonumber) and .date.month == ($month | tonumber)) | (.rx + .tx) / (1024*1024*1024)')
rounded_eleven=$(printf "%.2f" "$eleven")

echo " $rounded_eleven GB"
And that' about it, for Network Usage Gouger you need Network Monitor Package xfce4-netload-plugin
You can see more into here
Adios!
[ORIGINAL POST]
edit: I am open to installing other packages, I ain't married to any of these packages.

I have installed vnstat package and it's quite handy. I have a few questions about it though.
- What is
rx&txmean in this package?rxstands forreceivedtxstands fortransmission
Is there a command to check data usage on my system using this? I mean, I want to create a Add an item to my panel which will show me my daily data usage updating it every minute. Basically, I want to to see what the arrow points to on the panel next to my date and I want it to update it every minute. I have 1.5GBs of data a day and I usually am not able to use it efficiently or I use too early and spent hours without data. So, I want to try and handle this problem by monitoring my data.
Note: I want to measure gauge data speed here, not do a speed test on how fast my internet is.
Also, I want to monitor the instantaneous rate of data usage and for that package bwm-ng does a great job, but I want to see in the panel and I want it to update every 0.5 s how can I achieve this?
I would like for a command to either view red arrow or the black arrow with the right mark depending upon which of them is instantaneous data speed

Note to Future self:
rx : received
tx : transmission
lo : local loopback
wlan0 : ethernet
On which environment? I'm pretty sure there's option on most of the window managers to display output of an command on a panel and (while it might need some scripting) it should be easy(ish, YMMV) to implement that.
MX Linux xfce
I know it can be done because I have done it for something else. I don't know the commands to view those particular columns in the command tho.
I'm not familiar with vnstat, but man page mentions --oneline -parameter, so something like
vnstat --oneline|cut -d';' -f6might be pretty close and you could format that as you wish with sed or awk, shell script or even python if you like.thank you very much! it works!