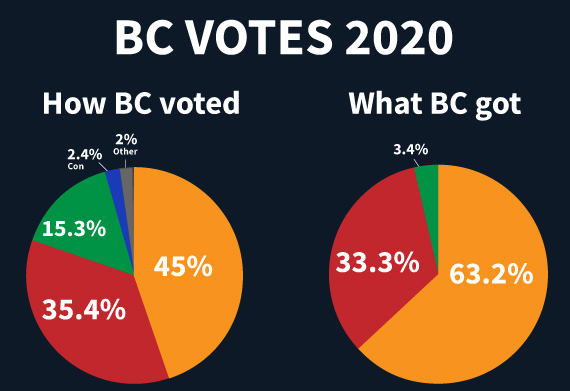
I'm confused by this graphic
One side shows which parties were voted for in the popular vote while the other shows how many seats each party got thanks to the unfair first past the post system
If I look at this alongside the other zoning map someone posted will it make more sense?
It’s a votes to seats thing, I believe. Like how in the federal election the NDP got 25 seats and the Liberals got 150+ but the NDP recieved well over half the votes the Liberals got. By that metric they should have gotten over 80 seats yet instead have to make do with less than a third of that.
I'm confused by this graphic
"Best" != "Perfect"
There was 63 and 45 and 15 but only 3 and 33 but also 35 of various colors that look vaguely like baby food.
Competition or a better voting system? Under first past the post adding more competition doesn't address the mismatch between votes and seats.
Fairvote Canada
What is This Group is About?/De Quoi Parle ce Groupe?
The unofficial Lemmy movement to bring proportional representation to all levels of government in Canada.
Voters deserve more choice and accountability from all politicians.
Le mouvement non officiel de Lemmy visant à amener la représentation proportionnelle à tous les niveaux de gouvernement au Canada.
Les électeurs méritent davantage de choix et de responsabilité de la part de tous les politiciens.
- What is First-Past-The-Post (FPP)?
- What is Proportional Representation (PR)?
- What is a Citizens’ Assembly?
- Why referendums aren't necessary
Related Communities/Communautés Associées
Resources/Ressources
Official Organizations/Organisations Officielles
We're looking for more moderators, especially those who are of French and indigenous identities.
Nous recherchons davantage de modérateurs, notamment ceux qui sont d'identité française et autochtone.
